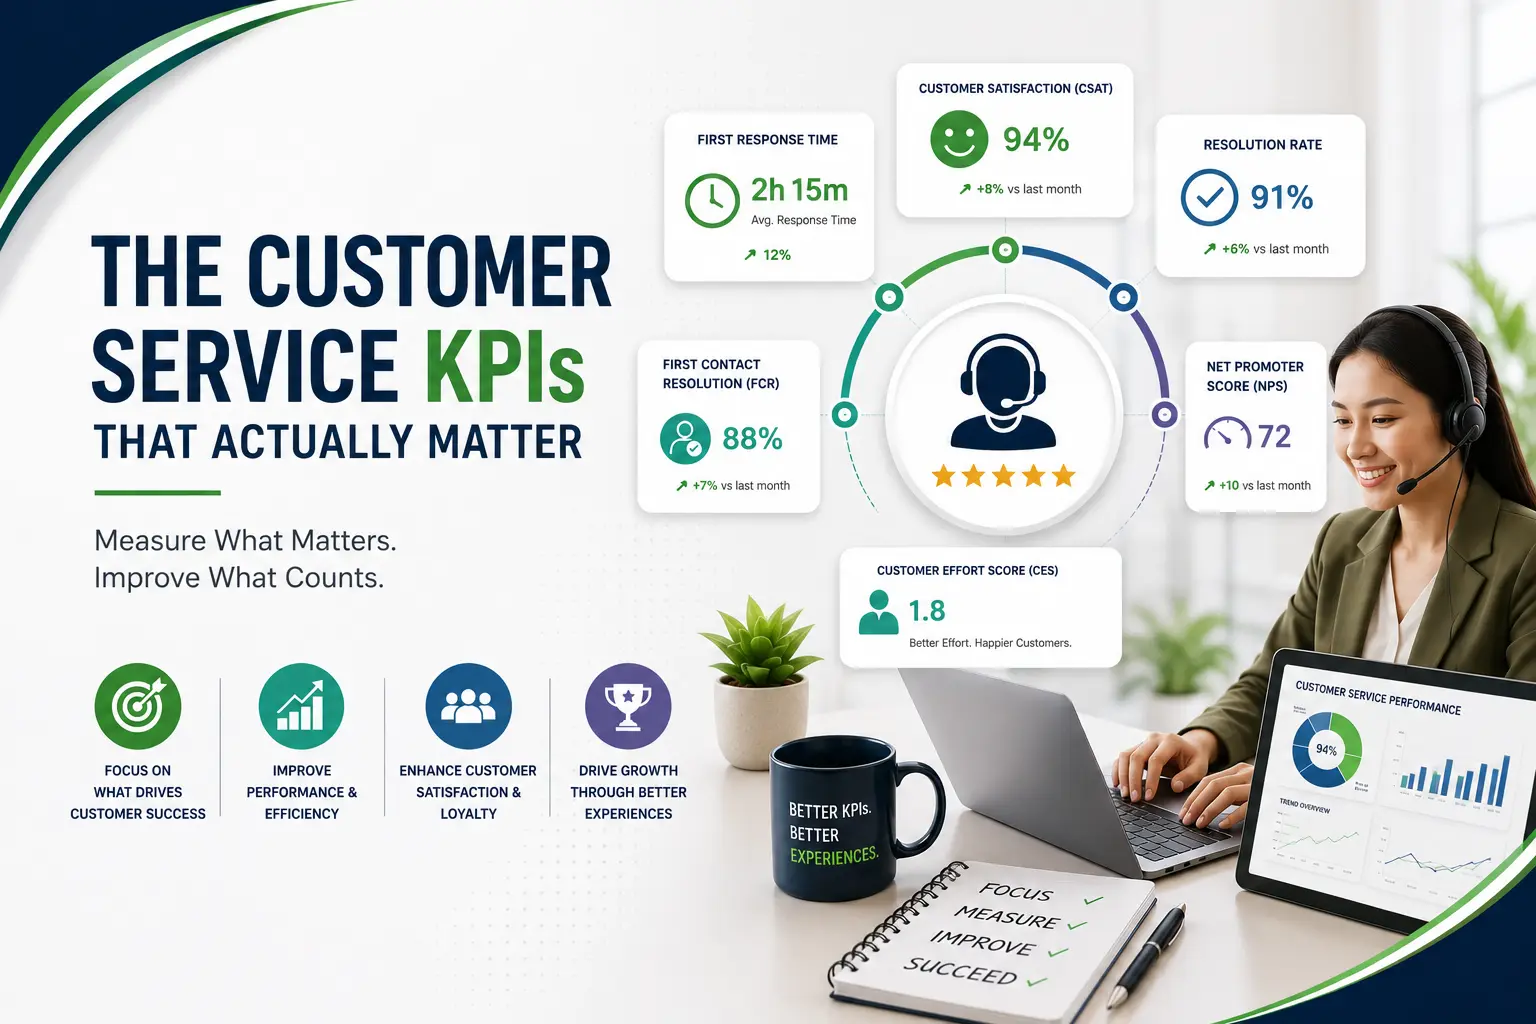
FCR, CSAT, NPS, AHT: The Customer Service KPIs That Actually Matter (and How to Use Them)
Customer service produces more data than almost any other business function – every call timed, every ticket tagged, every survey scored. Yet many businesses still cannot answer the only question that matters: is our service getting better or worse? The problem is rarely too little measurement; it is measuring the wrong things, or measuring the right things and reading them wrong. This guide covers the four KPIs at the core of every serious service operation, the supporting metrics around them, healthy benchmark ranges, and the classic traps that turn good metrics into bad decisions.
First Call Resolution (FCR): The King of Service Metrics
FCR measures the percentage of issues resolved in the customer’s first contact, with no follow-up needed. It is the single most predictive service metric because it sits at the intersection of everything: customer effort, agent capability, knowledge quality, and process design. When FCR rises, satisfaction rises, repeat contacts fall, and cost per resolution falls – a rare metric where customer interest and cost interest point the same direction.
Healthy contact centres typically operate in the 70–79% range, with world-class operations pushing above 80%. Measurement method matters enormously: define a window (for example, no repeat contact on the same issue within 7 days) and stick to it, because self-reported or loosely defined FCR flatters everyone.
To improve FCR, look upstream of the agents: knowledge base quality, routing accuracy (the right query reaching the right skill group), and agent authority (how much an agent can resolve without escalation). Low FCR is usually a system problem wearing an agent costume.
Customer Satisfaction (CSAT): The Transaction Thermometer
CSAT asks customers to rate a specific interaction, usually on a 1–5 scale, immediately after it happens. It is the sharpest tool for evaluating individual touchpoints: this call, this chat, this resolution. Scores in the 75–85% satisfied range are broadly healthy, though expectations vary sharply by industry.
CSAT’s power is its granularity – it can be sliced by agent, channel, query type, and time of day, making it the primary feedback loop for coaching and QA. Its weakness is response bias: the delighted and the furious answer surveys; the merely fine do not. Track response rates alongside scores, and treat trend movement as more meaningful than absolute level.
Net Promoter Score (NPS): The Relationship Barometer
Where CSAT measures a moment, NPS measures the relationship: how likely is the customer to recommend you, on a 0–10 scale? Subtract the percentage of detractors (0–6) from promoters (9–10) and you get a score from −100 to +100. Anything positive means more advocates than critics; scores above +30 are strong in most industries.
NPS is a leadership metric, not an operational one. It moves slowly, reflects the whole customer experience – product, price, brand, and service together – and is best read quarterly. The most valuable part of an NPS programme is usually not the number but the follow-up question: why? Coded verbatim responses tell you what to fix; the score alone just tells you whether to worry.
Average Handle Time (AHT): The Most Dangerous Metric
AHT measures the average duration of an interaction, including talk time and after-call work. It is essential for capacity planning – you cannot staff a support operation without it – and it is the metric most likely to damage your service if misused.
The failure mode is famous: make AHT a target, and agents rush. Calls get shorter; problems stay unsolved; repeat contacts rise; FCR falls; and total workload goes up while the dashboard glows green. The discipline is to treat AHT as a planning input and an anomaly detector – investigate the outliers, understand the drivers – while quality metrics like FCR and CSAT carry the performance weight. When AI agent-assist tools reduce after-call work, AHT improves as a by-product of better support, which is the only healthy way it improves.
The Supporting Cast
- Service level / answer rate – the percentage of calls answered within a threshold (classically 80% within 20 seconds) and the percentage answered at all. Abandonment above roughly 5% is an early warning of understaffing.
- Customer Effort Score (CES) – how easy was it to get help? Effort predicts loyalty strongly – customers forgive problems, but not obstacle courses.
- Quality assurance score – internal scoring of interactions against a rubric covering accuracy, compliance, and soft skills. This is the coaching engine behind every external metric.
- Cost per contact / per resolution – the commercial lens. Prefer cost per resolution: cheap contacts that don’t resolve anything are expensive.
Building a Dashboard That Drives Decisions
A usable service scorecard has three layers. The daily operational layer tracks service level, abandonment, and AHT anomalies – the is anything on fire? view. The weekly performance layer tracks FCR, CSAT by segment, and QA scores – the are we getting better? view. The quarterly strategic layer tracks NPS, retention, and cost per resolution – the is service building the business? view. Real-time analytics platforms make all three layers live rather than retrospective, which changes management from archaeology to steering.
One final principle: pair every efficiency metric with a quality metric. AHT with FCR. Cost per contact with CSAT. Deflection rate with effort score. Any metric optimised alone will be gamed – usually innocently, always expensively.
From Measurement to Management: Making Metrics Change Behaviour
A metric only matters if someone changes what they do because of it. The bridge from dashboard to behaviour is built with a few disciplines. Set targets as ranges informed by your own baseline, not as round numbers borrowed from industry benchmarks – a team told to hit ‘80% FCR’ when the current reality is 62% learns only that targets are fiction. Review metrics at the level where action lives: agents see their own CSAT and QA trends in coaching sessions; team leads see comparative queue performance weekly; leadership sees the strategic layer quarterly. Broadcasting every number to every audience produces noise, not accountability.
Beware the two classic failure modes of metric programmes. Goodhart’s trap – when a measure becomes a target, it stops being a good measure – is why efficiency metrics must always be paired with quality metrics, and why sudden dramatic improvement in any single number should trigger curiosity before celebration. The averaging trap is subtler: a healthy overall CSAT can conceal one channel, one language, or one query type in crisis. Always segment before concluding; the average is where problems go to hide.
Finally, close the loop with the people being measured. Agents who understand why FCR matters – fewer repeat contacts means fewer angry customers means better days – treat the metric as a tool rather than surveillance. The best service operations publish their definitions, share the reasoning behind targets, and celebrate quality wins as loudly as volume records. Measurement culture, not measurement tooling, is what separates teams that improve from teams that merely report.
KPIs in an Outsourced Relationship
Everything above applies doubly when support is outsourced, because the metrics stop being internal management tools and become the language of the contract. Three practices keep that language honest. Agree definitions before signing – how FCR is measured, when the CSAT survey fires, which timestamp starts the response clock – since two parties using the same acronym with different definitions will eventually dispute a number that both dashboards display correctly. Insist on shared, real-time visibility rather than provider-issued monthly summaries, so performance conversations start from common data. And build the review rhythm into the contract: weekly operational check-ins on the daily-layer metrics, monthly reviews on the performance layer, quarterly business reviews on the strategic layer. Providers confident in their delivery welcome this transparency – indeed, the enthusiasm with which a prospective partner discusses measurement, it is one of the most reliable selection signals available.
Frequently Asked Questions
What is a good first call resolution rate?
Most well-run operations sit between 70% and 79%, with world-class teams above 80%. The definition matters: measure it as no repeat contact on the same issue within a defined window, not agent self-reporting.
What is the difference between CSAT and NPS?
CSAT measures satisfaction with a specific interaction immediately after it happens; NPS measures overall relationship loyalty over time. Use CSAT to manage service operations and NPS to gauge brand health.
Should average handle time be an agent target?
Generally no. Targeting AHT encourages rushed calls, which lowers resolution and increases repeat contacts. Use AHT for staffing and anomaly detection while quality metrics carry performance weight.
How many KPIs should a support team track?
Operationally, four to six headline metrics with supporting drill-downs. Beyond that, dashboards stop informing decisions and start decorating them.
Can an outsourced team be held to these KPIs?
Yes – that is precisely what a service level agreement is for. A professional BPO partner commits to FCR, CSAT, service level, and quality targets contractually, with transparent reporting so performance is verifiable.
Ready to get started? Antasis builds measurement in from day one – satisfaction surveys and analytics, real-time reporting dashboards, and SLA-backed KPI commitments across every engagement. If you can’t currently answer ‘Is our service getting better?’ talk to us at antasis.com/contact-us. |
Contact Antasis
Ready to explore how outsourcing can work for your business? Reach the Antasis team directly:
Email | sales@antasis.com |
Singapore HQ | Blk 162 Bukit Merah Central #06-3545, Singapore 150162 |
Singapore | +65-6319-2620 |
Philippines | +63-920-619-1194 |
Malaysia | +60-7587-9041 |